Machine Learning & Data Analytics
"You can have data without information, but you cannot have information without data."
-Daniel Keys Moran

Machine Learning requires careful data analysis in feature selection and engineering. In each project you will
find an exploratory data analysis section (EDA) which explores the features and target variables. These sections often
contain data visualization and table analytics to get a better understanding of the underlying relationships. My basic approach
to each supervised learning project is:
1) Import data
2) Data preprocessing
3) Exploratory Data Analysis
4) Encode variables
5) Split into training/testing sets and apply feature scaling/normalization
6) Run several Machine Learning algorithms and interpret their scores
7) Build a deep learning neural network
8) Compare all models results.
Classifying Baseball Pitch Based on Ball Spin
Baseball is often thought as a game of many statistics. Pitching is one of the best ways to analyze the game. In this machine learning project I used several machine learning techniques to classify the type of pitch based on the baseball's X,Y,Z coordinates from the time it leaves the pitcher's hand to when the ball crosses homeplate. The MLB dataset contains 40 features with 12 classifications of pitch types.
Results of Supervised Learning algorithms below. My deep convolutional neural network built with Keras Dense layers (4) perfomed 1 percent more accurate than XGBoost - a solid benchmark for classification problems - for an average accuracy of 85.55%.
- Decision Tree: 78.55% accuracy
- Random Forest: 81.34% accuracy
- kNN: 81.66% accuracy
- Gaussian Naive Bayes: 65.11% accuracy
- Extreme Gradient Boost: 84.40% accuracy
- Deep-CNN (my model): 85.55% accuracy
Detecting Vehichle Fraud
Supervised learning algorithms performed on a vehichle insurance dataset containing 94% non-fraudulent and 6% fraudulent insurance claims. The goal of supervised machine learning in this scenario is to train the patterns of fraudulent claims from 80% of the dataset and to validate the training parameters on the remaining 20% and assess the accuracy score through series of classification reports that measure precision, recall, F1-score, and confusion matrix. Because of the uneven distribution in non-fraudulent claims and fraudulent claims, Synthetic Minority Oversampling Technique (SMOTE) was performed for scaling the features. Label Encoding was performed for most of the categorical features. Most of the features pertain to: Dates (month, day, year); Car (make, model, year, type of vehichle), Person (sex, marital status, age); Policy (policy type, deductible, policy number).
Results of Supervised Learning algorithms below.
- Decision Tree: 90% accuracy
- Random Forest: 94% accuracy
- kNN: 85% accuracy
- Adaboost: 94% accuracy
- Bagging: 95% accuracy
Korea Sports Foundation Body Performance Classification
Korea Sports Promotion Foundation (KSPO) has been dedicated toward advancing active lifestyles through sports for its South Korean citizens by nearly
investing 7 billion dollars since being established in 1989. This supervised machine learning study compares different models to predict people
into labelled categories. I found ensemble methods, random forest and extreme gradient boosting, and deep neural networks to classify new people
3 times as accurate as random selection with around 75% accuracy. Furthermore, I found that the original 11 features can be reduced down to only
5 features, through feature ranking and Prinicipal Component Analysis, for a cost of 2% accuracy reduction. This means that South Korea Sports staff
can automatically classify new people into their 4 categories of body performance with simple measurements like Age, BMI, blood pressure rather than
measuring more difficult features like broad jump, grip force, or activity counts like sit-ups.
Results of Supervised Learning algorithms below. My deep convolutional neural network contains 4 fully connected layers with 170,884 trainable parameters.
- Decision Tree: 64.84% accuracy
- Random Forest: 73.72% accuracy
- Gaussian Naive Bayes: 53.98% accuracy
- Support Vector Machine: 63.79% accuracy
- Extreme Gradient Boost: 75.85% accuracy
- Deep-CNN (my model): 73.00% accuracy
Driving Behavior Classification Based on X,Y,Z coordinates
Supervised machine learning algorithms were implemented to learn the traits of four driver behaviours: 1) sudden acceleration, 2) sudden right turn,
3) sudden left turn, 4) sudden break. The dependent variables are based on 60 independent variables that relate to the accelerometer measured in
the X,Y,Z axis in meters per second. Three different drivers (age: 27, 28, 37) driving three different car models
(Ford Fiesta 1.4, Ford Fiesta 1.25, Hyundai i20) were used in the dataset.
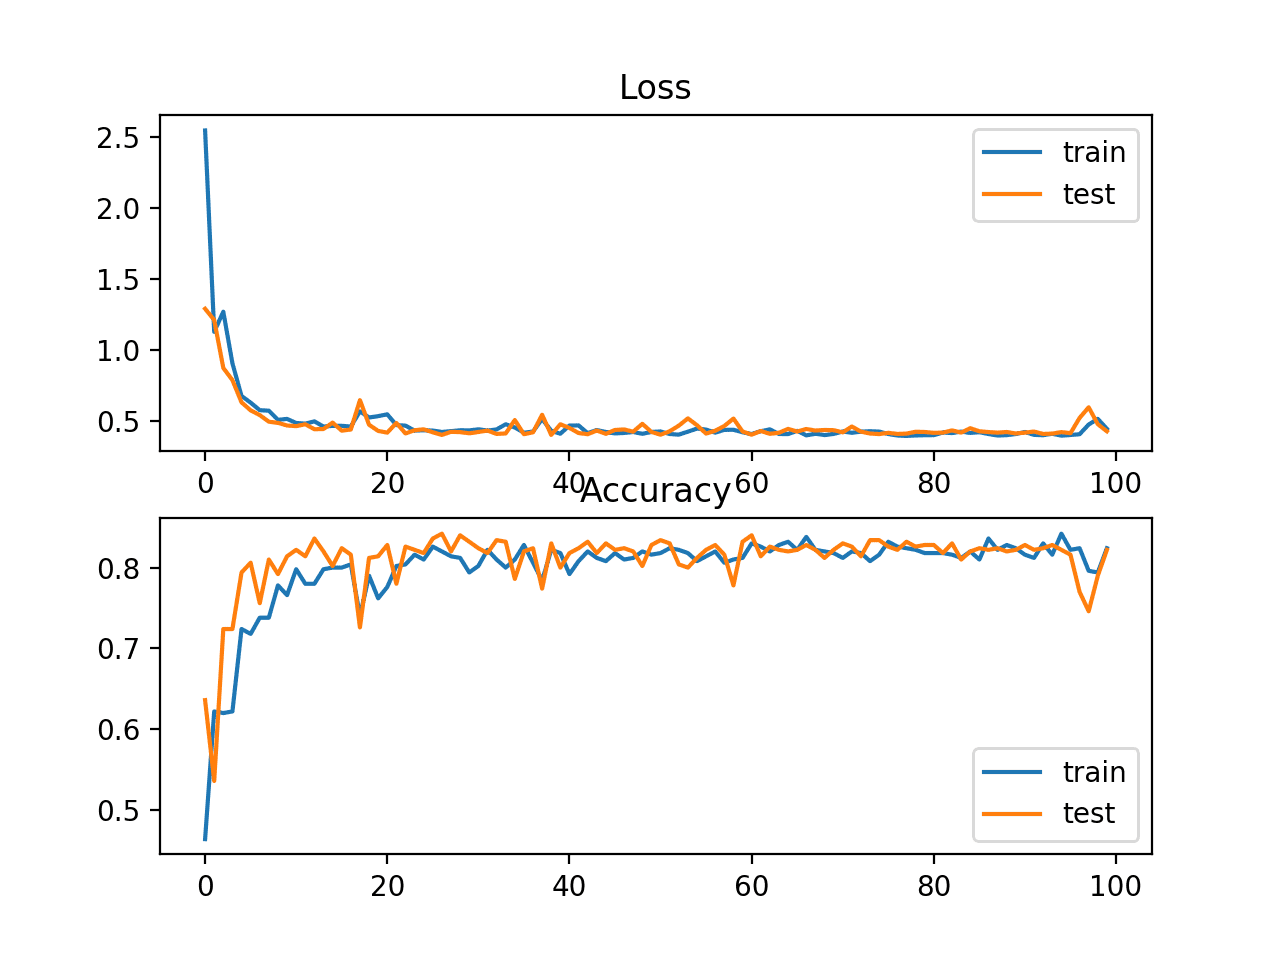
Results of Supervised Learning algorithms below. My Keras CNN model (100 epochs) outperformed decision tree, but fell short of random forest ensemble method. The confusion matrix of the CNN shows one observation being classified as a sudden left turn when in was actually a sudden acceleration.
- Decision Tree: 99.10% accuracy
- Random Forest: 100.00% accuracy
- Deep-CNN (my model): 99.32% accuracy
USA Real Estate Price Regression Predictions wtih ML and Deep neural networks
Supervised Learning algorithms for regression were implemented to predict real estate prices by assessing the Mean Average Error, which provides a metric to determine the difference between predicted value and the true value. Predictions were made by training the following features: beds, baths, house size, acre lot, zipcode, state, date sold. 900k observations were present in the dataset ranging from 12 different US states. House prices range from $10,000 to $60,000,000 with $450,000 as the median and $749,200 as the average house price. Although the data is skewed from different US states and zipcodes, the primary point of analysis is to compare different SL models with my own Deep neural network using Tensorflow and Keras.
Results of Supervised Learning algorithms measured by MAE, which tells us how far off the prediction was to the actual values based on the input features.
- Mean Absolute Error using Decision Tress : 15,203.53
- Mean Absolute Error using Random Forest: 22,209.82
- Mean Absolute Error using XGBoost: 158,738.68
- Mean Absolute Error using RANSAC Regressor: 491,908.11
- Mean Absolute Error using DNN (my model): 117,695.53
Gender of Voice Prediction:
Supervised Learning algorithms implemented to predict the gender of voice. 20 features were trained to predict Male or Female voices across 3,168 observations with equal distribution. Results of Supervised Learning algorithms below.
- Decision Tree: 97.63% accuracy
- Random Forest: 97.48% accuracy
- Support Vector Machine: 97.63% accuracy
- XGBoost: 97.48% accuracy
- CNN (my model): 97.48% accuracy
Statistics Papers with SAS
Foundation of understanding data structures and statistical analysis. SAS and Python primarily used for exploration and Learning
Other Python and Java
scripts for Data Science
Ranging from basic to advance, python and java used for various tasks mostly related to tabular data.
- © Untitled
- Design: HTML5 UP